emenu
Featureschevron_rightGrowth and analyticschevron_rightAnalytics
monitoringPro

Analytics

See what guests do on your menu.

Analytics · emenu panel screen
lockThis feature is in ProOn the Free plan? Upgrade, or try it free for 14 days with no card.See plans
Overview

What is menu analytics?

Menu analytics are report pages that show what guests do on your QR menu. You see how many times the menu was opened, which hours were busy, which products were viewed and how guests moved around the menu.

With a printed menu you can’t tell which product gets attention; on a digital menu every view is data. With it you notice a product with a weak photo, a category nobody opens or a table QR that never gets scanned. You base decisions on guests’ real behavior, not guesswork.

Tracking starts the day you sign up and runs regardless of your plan. On the Free plan the analytics page appears blurred with sample data; when you upgrade to Pro, you see the data you’ve built up.

What you can do

Analytics ile

check_circleDaily visitors and QR scans
check_circleHour × day traffic heat map
check_circlePer-table statistics
check_circleTime spent on the menu and category-to-product click-through rate
check_circlePage journeys
check_circle“Viewed together” products and popular products
check_circleMeasured from the day you sign up
How it works

Three steps.

01
Keep your menu live; tracking starts the day you sign up.
02
See your busy hours on the Analytics page.
03
Adjust your menu based on popular products.
Details

Analytics: details

Daily guests

Pick a day and see the guests who opened your menu that day, with times. For each guest, the device, browser and number of menu pages viewed are listed. A summary of the day sits at the top of the page.

  • checkUnique guests
  • checkMenu views
  • checkMost used device and browser
  • checkJump to the previous or next day with one click

Traffic heat map and table statistics

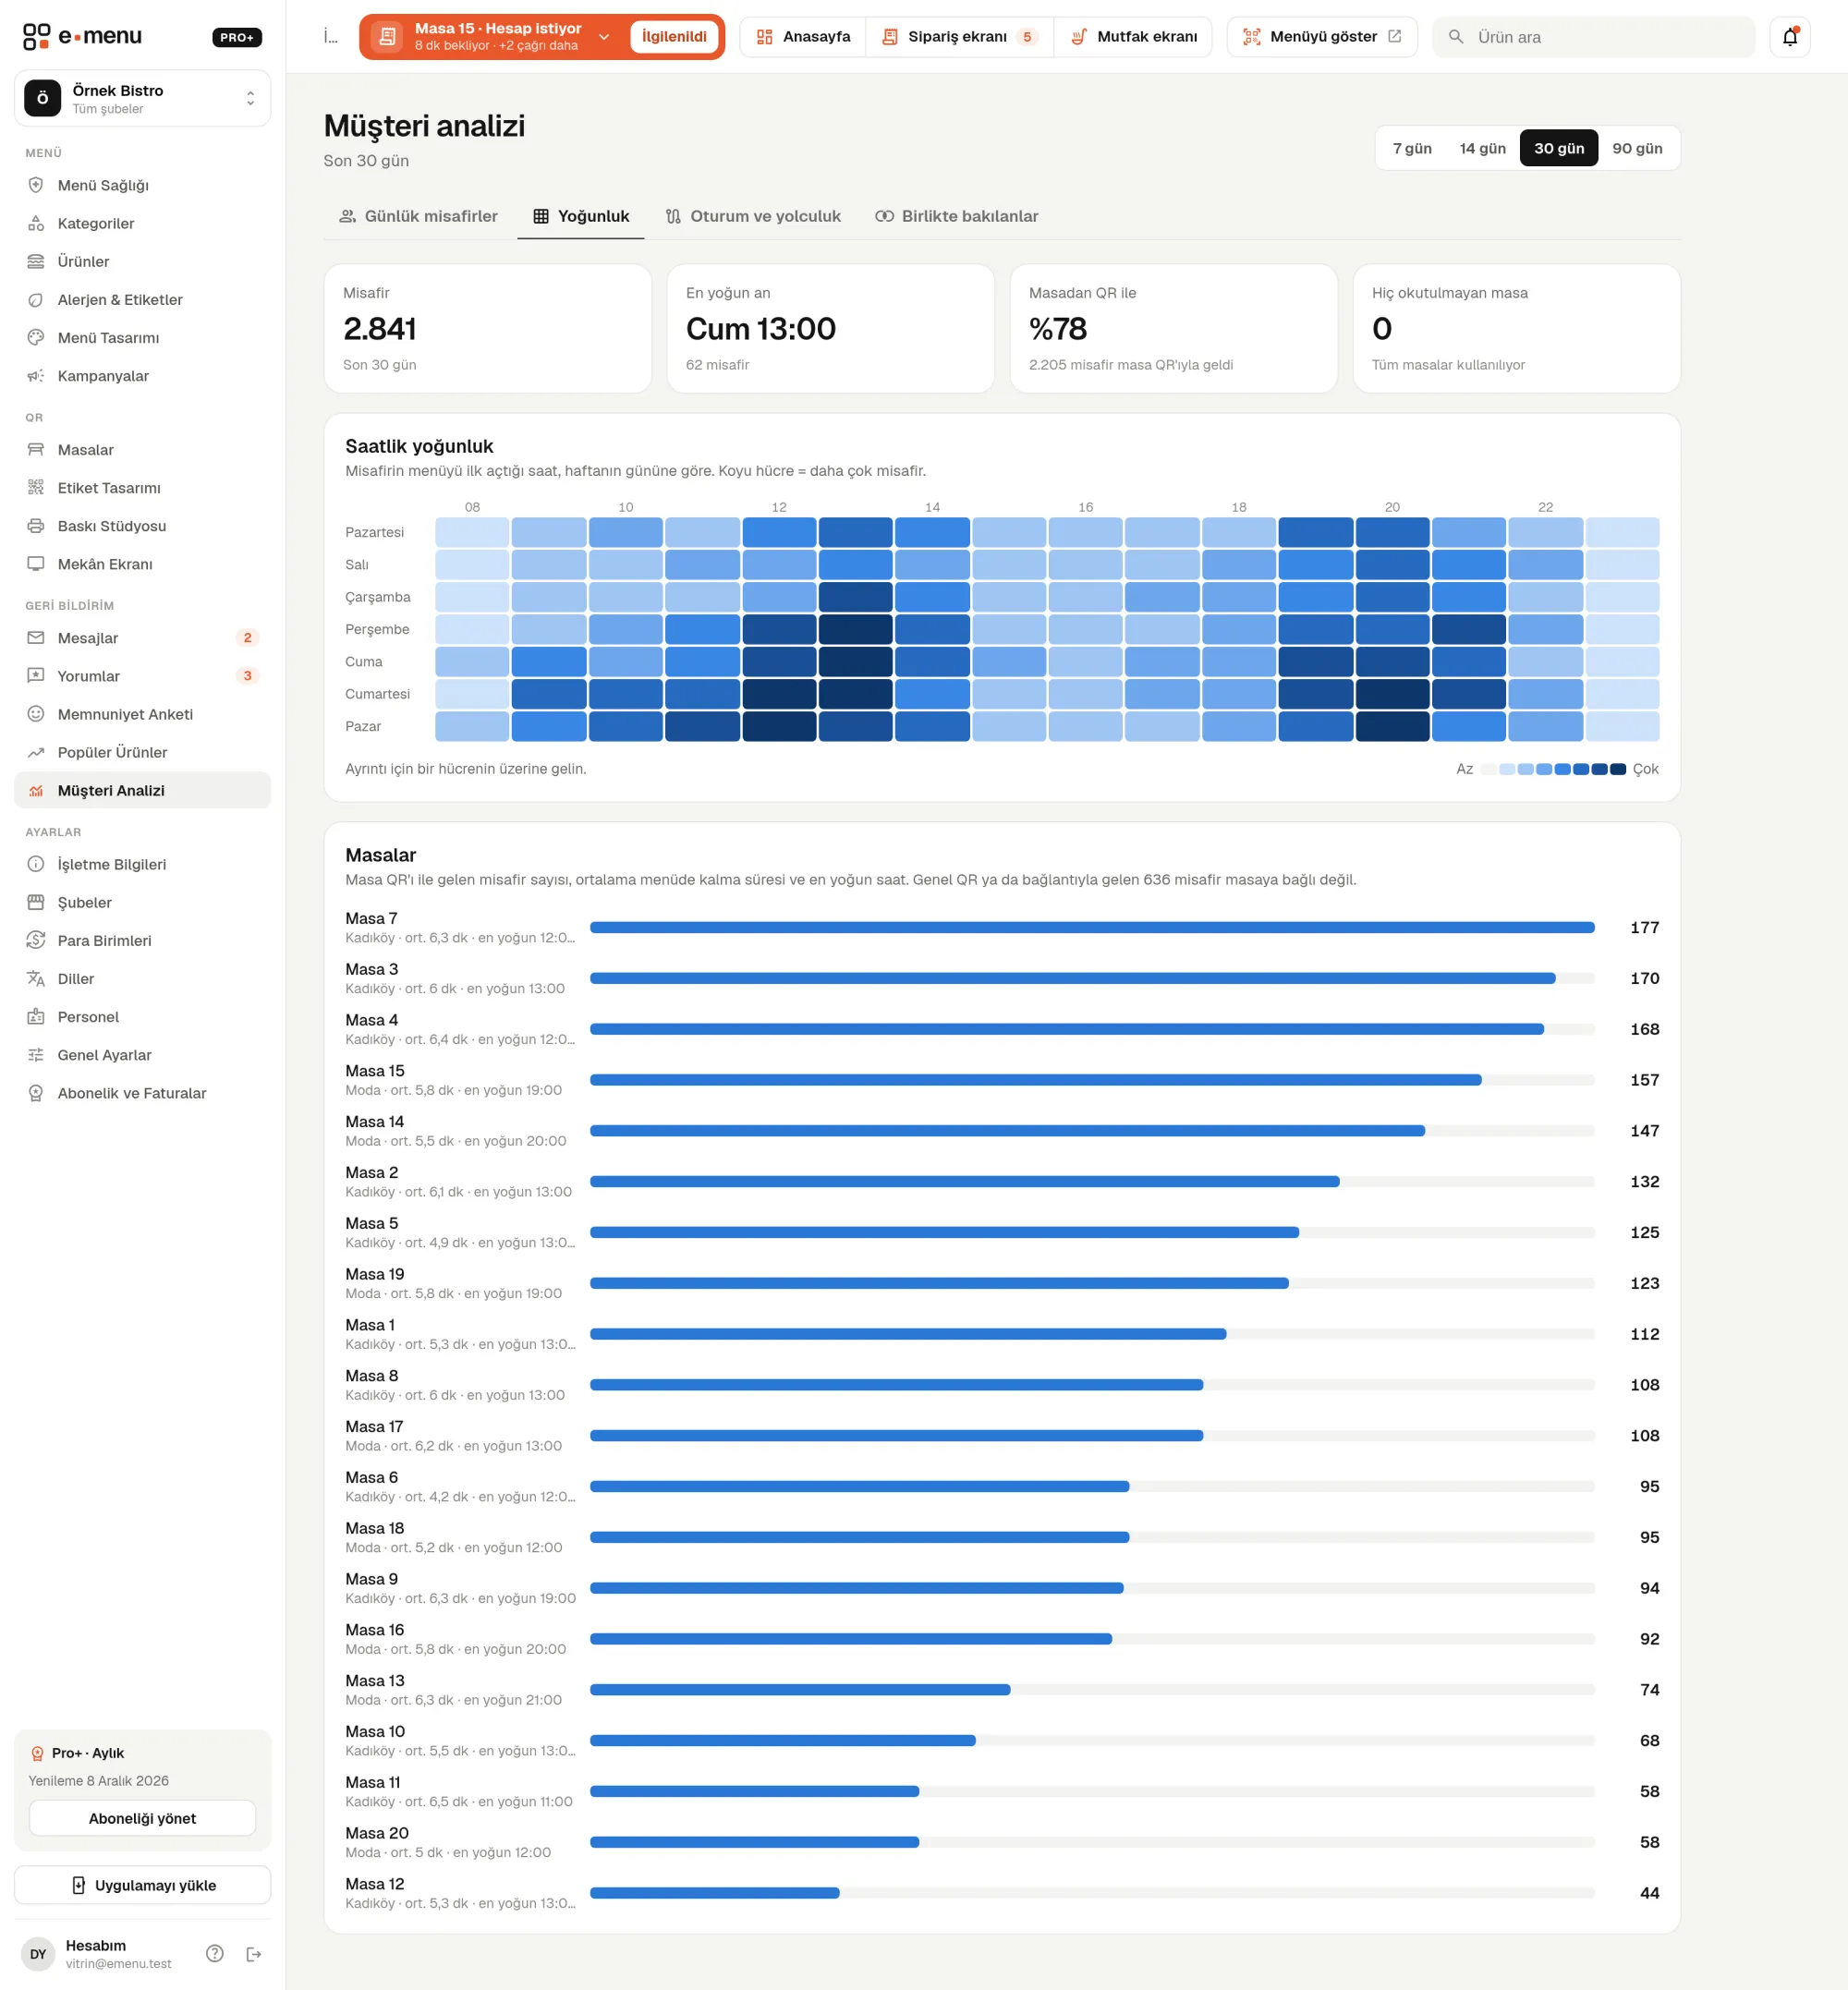
The number of guests opening the menu for every day of the week and every hour of the day is color-coded in one table; a darker cell means more guests. Next to it, tables are ranked starting with the most scanned QR.

  • checkLast 7, 14, 30 or 90 days
  • checkBusiest day and hour of the week
  • checkNumber of guests arriving via table QR
  • checkTables never scanned in the selected period

Sessions and page journeys

You see how much time passes from when a guest opens the menu to their last action, and which page they moved to from which. That way you understand where guests get stuck and where they leave the menu.

  • checkAverage time on the menu
  • checkPages per session
  • checkCategory-to-product rate: how many of those who opened a category looked at a product’s details
  • checkMost frequent page transitions, menu entry and exit points

Popular products and viewed together

The Popular products page ranks all your products by how many times their details were viewed; you can start from the least viewed if you prefer. Viewed together shows pairs of products viewed by the same guest on the same day. These pairs hint at products to place side by side, recommend together or include in a campaign.

How is data counted?

Automated visits such as search engine bots aren’t counted. If the same guest reopens a product’s details within 30 minutes, it counts once. Analytics pages are visible to the owner and staff with the Manager role; you don’t need to install code or an external analytics tool.

In the panel Analytics5 screens
Analytics · emenu panel screen
Use cases

Who uses it, and how?

01

Breakfast-focused café

The heat map shows weekend mornings are very busy and weekday afternoons are quiet. It sets up a time-limited discount for the quiet hours and checks the map again in the following weeks.

02

Restaurant renewing its menu

In Popular products, it notices products that are almost never viewed and a category with a low category-to-product rate. It adds photos and descriptions to those products and watches whether the rate changes.

03

Large venue with a garden

Table statistics show that the QR codes on some garden tables are never scanned. It checks on site whether the label is worn or stuck in the wrong place.

04

Bistro serving desserts and coffee

The viewed-together list shows a certain dessert and filter coffee are often viewed together. It places them side by side on the menu or features them together in a campaign.

Frequently asked questions

Analytics : questions

Analytics and popular products are in Pro and Pro+. The Free plan has the QR scan chart on the panel home page; the analytics page appears blurred with sample data.

Related features

monitor_heart
Menu Health
A 0–100 score that tells you what will improve your menu.
Free
campaign
Campaigns
Show campaigns on your menu in the right place, at the right time.
Pro
sentiment_satisfied
Satisfaction survey
Measure what your guests think, NPS included.
Pro
Pro · 99 ₺ / month + VAT

Grow your menu with Pro.

Try free for 14 daysCompare plans